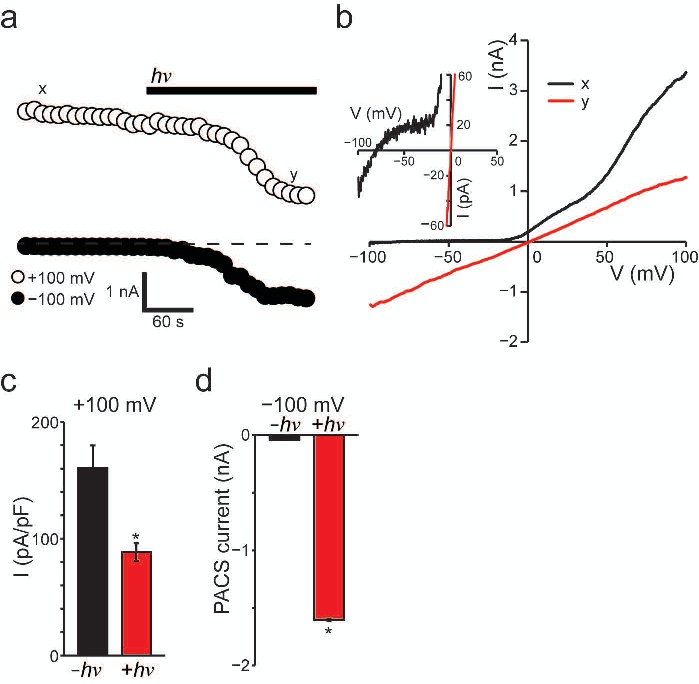
Fig. 2. Photo-induced change in the membrane current of PC12 cells containing TC1. Representative traces of time-dependent changes in the membrane current (a) and current−voltage (I−V) curve (b) under illumination (black bar, hν: 525−550 nm, input power 2 mW cm−2) are shown for PC12 cells treated with TC1-loaded cpHDL. The dashed line indicates zero current level. The black and red curves in (b) were collected at the time points indicated by x and y, respectively, in (a). The insets in (b) show magnified views around the V-axis intercept. (c,d) The average of the photo-induced changes in the membrane current before (-hν) and after (+hν) illumination at +100 mV (c: current: I) and at -100 mV (d: photo-activated CS molecule induced (PACS) current), respectively. *p<0.05 vs. -hν (n = 5).